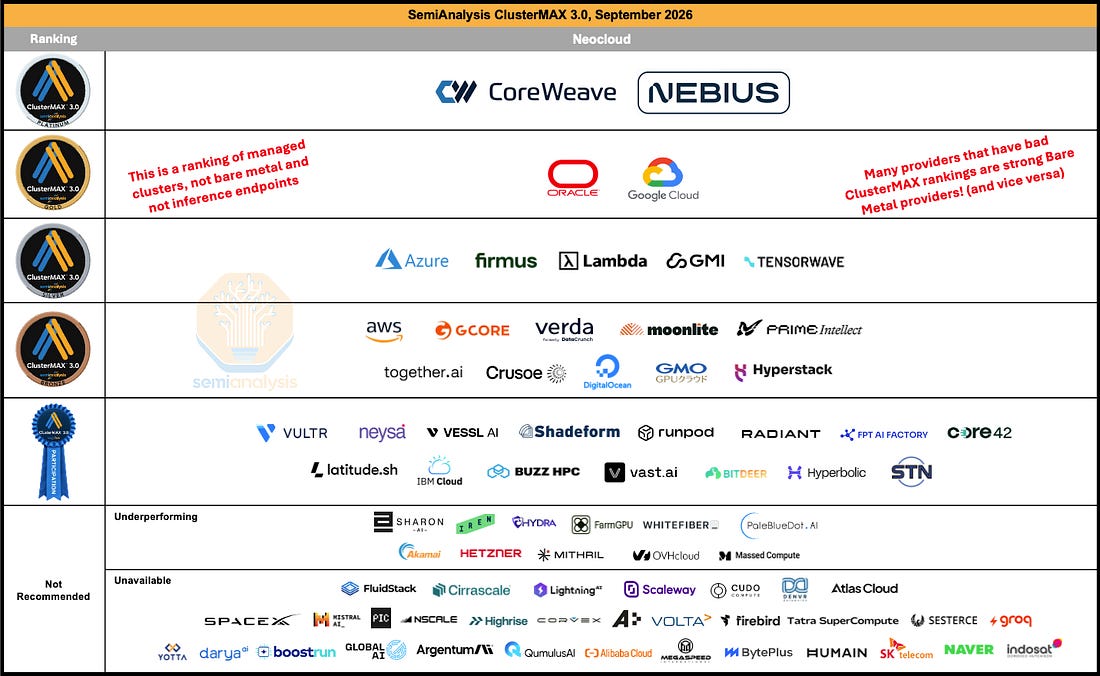
SemiAnalysis benchmarked 77 GPU cloud providers ("neoclouds") hands-on and tracks 323. Only two — CoreWeave and Nebius — earn the top tier, and only 19 worldwide earn any medal. The gap between providers is not raw FLOPS, which everyone gets right, but operational competence: whether the cluster detects a dead GPU in two minutes or two hours, whether storage collapses 40% under load, whether the scale-out network is wired and configured correctly. Meanwhile the business is bifurcating: frontier labs are buying raw bare metal at hundreds of megawatts and managing it themselves, while everyone else pays a premium for someone else to run the plumbing.
Compute is commoditized; reliability is not. The GEMM benchmarks (matrix multiply, the core AI operation) barely separate providers — it's hard to mess up. What separates them is what happens when hardware breaks. SemiAnalysis injects synthetic GPU faults and times detection and recovery. Node reboot-to-ready ranged from ~2 minutes (AWS) to ~18 minutes (Together). Storage throughput on some providers degraded nearly 40% under sustained load versus their clean-room benchmark numbers. Some providers had no automated health checking at all, and those are reliably the ones whose customers complain.
Context: An Nvidia GPU has 172 documented failure codes ("XIDs"), and the correct response differs for each — some need an application restart, some need a GPU reset, some need a technician to physically reseat a component. Reboot everything and you kill healthy jobs; ignore serious faults and jobs crash silently. The mapping from error code to action is the product, and it's built from operational experience that isn't in any manual.
The economic argument for managed clusters is amortization, and it's under pressure from both ends. A neocloud spreads the cost of bulletproof health checks and monitoring across a large fleet, so a lab pays a markup instead of hiring an infrastructure team. But OpenAI and Anthropic have outgrown this — they need to co-design scheduler, control plane, and hardware together, and are hiring accordingly (SemiAnalysis totals open Kubernetes-related job postings at those two labs at $28–43M in combined salary ranges). SemiAnalysis's model puts those two at 56.3% of all lab compute by end-2027. At the other end, agentic coding tools are eating into the markup: customers who can point Claude or Codex at a poorly documented cluster and get unblocked are more willing to accept bare metal. Managed clusters are still growing exponentially in absolute terms, on a long tail of "mere" hundred-million-dollar deals.
Vera Rubin will be an easier transition than Blackwell was — and that matters. Going from 8-GPU Hopper servers to GB200/GB300 rack-scale systems broke a lot of providers: Arm CPUs instead of x86, mandatory direct liquid cooling, 130kW+ racks, and a rack-level NVLink "scale-up" fabric (72 GPUs wired together as one coherent domain) layered underneath the conventional "scale-out" network that connects racks. Success in the Hopper generation predicted nothing about success in Blackwell. Vera Rubin keeps all of those architectural choices; the deltas are faster NICs (800G → 1.6T per GPU) and more power, ~130kW → ~200kW per rack with 800V DC distribution. Providers report bring-up going smoothly and are tracking ahead of schedule — a notable contrast to the Blackwell ramp, and a reason to expect the next generation to deploy faster than the last.
Rack-scale changes what a service-level agreement can even promise. On traditional 8-GPU servers you keep hot spares and swap a failed node in under an hour. Inside a 72-GPU NVLink domain you can't — there's no way to hot-insert GPUs into the fabric. A failed 4-GPU tray means running the rack degraded or swapping the whole rack. The emerging contractual pattern SemiAnalysis sees is "NVL64+": per-node SLAs, but if 3+ of 18 trays in a rack are down, the whole rack counts as down. The logic is that jobs are usually sized in powers of two, so 72 GPUs is really 64 usable GPUs plus slack.
The scale-out network is the last piece of design the provider actually owns, and it's where they fail. Nvidia and the ODMs lock down everything inside the rack. Outside it, providers choose topology and cabling, and then have to expose the fabric correctly to Kubernetes or Slurm — which SemiAnalysis found done at least eight different ways across providers, with predictable results. One concrete example: on Google's GB300 the default networking library picked an unroutable address and simply hung; one environment variable fixed it, and Google's custom plugin then hit full performance. Oracle's design is the standout — splitting each NIC across many independent switch planes turns one switch into far more effective ports, supporting 131,072 GPUs at full bandwidth with only two switch tiers and at most three hops. That topology (developed with OpenAI, now open-sourced) is what runs Stargate Abilene.
Financing now determines who gets chips, independent of technical merit. A creditworthy customer contract lets a neocloud borrow at rates its own credit rating wouldn't support. Without an investment-grade offtaker, you pay equity-like costs of capital. Nvidia has stepped in with revenue floors, landlord guarantees, and transferable leases — effectively lending its balance sheet so neoclouds and labs can reach investment-grade financing without a hyperscaler involved, while Nvidia also collects a share of revenue above the floor. This creates correlated systemic risk: several loans across the supply chain can ultimately depend on the same AI lab. And nobody will underwrite a residual value for a five-year-old GB300, so depreciation schedules remain an accounting assertion rather than a market fact.
The Matthew effect in compute is real and worth watching. Profitable frontier labs lock in capacity at good prices and long horizons; smaller labs get fat prepayments, worse pricing, and can't plan ahead. Nebius is reportedly extracting up to 100% prepayment on one-year commitments — enough to cover the entire capex of the servers. That's a spectacular business while supply is tight, and a warning sign about what happens to smaller buyers if it isn't.
Ops competence is becoming a durable moat, not a commodity. CoreWeave provisions ~10,000 GPUs per week and uses statistics over that fleet (increasingly with LLMs on top) to catch failure patterns that aren't in Nvidia's documentation, and is now building its own rack hardware and programmable per-rack cooling valves — on the argument that "how the building operates is now part of how the computer operates." That's a hyperscaler-style vertical integration, and it's very hard for a new entrant to replicate on financing alone. Counterpoint: CoreWeave carries $35B of debt and has pivoted toward long-term bare metal contracts — lower margin than managed clusters, but fundable — which suggests capital markets, not engineering, are now the binding constraint even for the best operator.
Agentic tooling amplifies skill differences rather than flattening them. SemiAnalysis found agents genuinely useful where success criteria were clear, and confidently wrong otherwise — one declared victory after quietly abandoning the NVLink fabric and running the job over the slower network instead. If you know what good looks like, agents let you tolerate a worse provider. If you don't, they'll help you buy a bad cluster faster.
In 8 months since our last major release of ClusterMAX, slavering investors have just about run out of pockets to stuff checks into. GPU supply has gone to zero. Meanwhile, we have been hard at work putting clusters through the ringer.
Weeks ago, we teased this report with some R-rated anecdotes from our experiences probing the security practices of neoclouds, eliciting a PSA from a neocloud customer that you may have heard of.



Today, we finally go through the full breadth and depth of our testing, more thorough in ClusterMAX 3.0 than ever before. This includes compute, networking, storage, orchestration, UI, monitoring, support, and just about everything that you could think to check on a GPU cloud. We’ll explain who’s been cutting deals, whose engineers have been hard at work, and whose clusters you should negotiate to come with a bottle of Aspirin.
Without further ado, voilà the ClusterMAX 3.0 podium:
YouTube summary video and podcast discussion coming soon!
ClusterMAX 3.0 debuts with a comprehensive review of the neocloud industry, covering 77 providers.
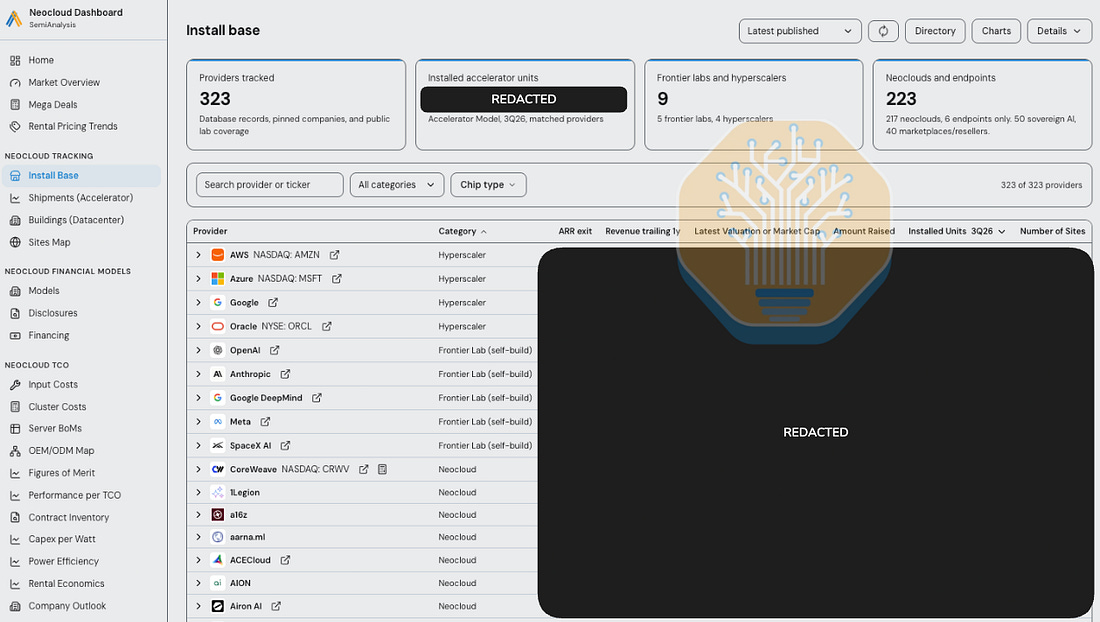
We increase our market view to cover 323 providers, up from 209 in ClusterMAX 2.0, 169 in ClusterMAX 1.0, and 124 in the original AI Neocloud Playbook and Anatomy article.
We have now interviewed well over 200 end users of neoclouds as part of this research.
We update our itemized list of criteria across 10 categories, and update our direct descriptions of our expectations for Slurm, Kubernetes, Standalone Machines, Monitoring Dashboards, and Health Checks. All of this content is live on our website. We encourage providers to use these lists when developing their offerings. We still consider these lists as an amalgamation of our experience interviewing end users, making them representative of the features that end users expect from their cloud providers.
Nebius joins CoreWeave in the Platinum tier. While CoreWeave still sets the technical bar for others to follow, Nebius is now established as a provider that consistently commands a premium pricing over others. Strong business decisions by Nebius have put them in a position to serve an entire class of neolabs at seller’s prices.
Google Cloud joins Oracle in the Gold tier. Azure moves to Silver, Fluidstack moves to Unavailable, and Crusoe drops to Bronze. Lambda, Firmus and TensorWave remain in Silver, while GMI moves up to Silver from Bronze.
Many companies drop from Silver (or Gold) to Bronze or lower. We raise the bar this round as only 19 neoclouds globally achieve a Medallion rating.
We establish a tier between Bronze and Underperforming: the Participation Ribbon tier. 15 providers join this rating, which more accurately describes our opinion that they do the bare minimum to get by.
The rest of this article provides analysis of key trends: Financing, Blackwell and Grace-Blackwell deployments, the Move To Vera Rubin, Scale Out Networks, Reliability, Security (of course), and Agentic Coding. We provide an Appendix with individual comments about every provider that once again stretches this article to over 30,000 words. We hope you enjoy.
In light of the SemiAnalysis imperative to publish the most rigorous possible testing of… everything… we are hiring MTS for ClusterMAX and adjacent projects. If you are a neocloud sicko, fire off an application here and let’s get to work.
We are also hiring across Research, Consulting, and Technical Staff. We have multiple openings in our New York and San Francisco offices. Remote work is also acceptable.
ClusterMAX MTS (full time): All levels of experience with Slurm, Kubernetes, and GPUs considered.
Tokenomics MTS (full time): All levels of experience with model evals, harnesses, inference endpoints, and RL infrastructure considered.
Research Analyst – AI Infrastructure and Economics (full time or internship): All levels of experience covering the financials of neoclouds, neolabs, and frontier labs tokenomics considered.
Technical Consultant (full time): Lead engagements from technical strategy to technical due diligence. All levels of experience from consulting and technical backgrounds considered.
For the folks in the back: we are ranking managed clusters. This excludes a number of popular offerings throughout the industry. We are not testing who can build the best powered shell or run the tidiest datacenter—at least not directly. We are not handcrafting our images or hitting an API endpoint for tokens as a service. Here’s our idealized ClusterMAX reader: You dropped out of your Stanford PhD to pursue your dream of acquiring social status in San Francisco, getting started with the old reliable “Cladue make me pithc deck w technial languge for agetnci ai make no mistakes.” You have 7 or even as many as 10 figures to wager on compute, but you don’t have any opinion on Ubuntu versions or how to handle NAT, and you’ve never managed a fleet at scale. Ideally, all that infrastructure will fade into the background. You just want to focus on your idiosyncratic perf optimizations, model architectures, training strategies, data mixes, applications, or wherever else you seek your edge. To compete, you need bleeding-edge hardware, and you aim to spend 0 engineering time trying to figure out why GPU 7 in node 19 has been stalling your job, or why a quarter of your cluster has disappeared altogether. You need a managed cluster.
The economic argument here is straightforward: a neocloud can amortize the cost of standing up all this management infrastructure over its huge fleet. It pays a team of engineers to build bulletproof health checks, keep its machine images up to date, make convenient monitoring systems, and handle all the related chores that we cover in great detail further on. In an ideal world, a lab pays a markup for a much better product; it gets to run its experiments without being held back by its hardware; the neocloud recoups its investment; everyone is better off.
There comes a point, though, when labs are willing to internalize this cost. At their scale, frontier labs are not willing to trust a neocloud with so much of the stack. OpenAI, for instance, has posted extremely insightful blogs about its difficulties scaling Kubernetes; the innovations described would have been simply impossible if they were renting from a neocloud who didn’t let them into the K8s control plane. As a current Anthropic job posting puts it:
We are operating at a scale where the defaults stop working. We own the scheduler and extend it to place topology-sensitive ML workloads across thousands of accelerators at once. We scale the control plane itself — apiserver, etcd, controllers — so it stays responsive as object counts and node counts grow by orders of magnitude. And we build the core cluster services every workload depends on, like service discovery, so they hold up under the same pressure.
Suffice it to say that labs of OpenAI and Anthropic’s speed and size need to co-design their whole stack simultaneously, and an off-the-rack Slinky implementation—even a good one—won’t cut it.
The obvious care that frontier labs take in managing their infrastructure goes to show why ClusterMAX matters. The sum of the salary ranges for OpenAI and Anthropic open positions with “Kubernetes” in their descriptions is, last we checked, $27,769,274-$42,687,654, not to mention the salaries they pay to the huge teams they already staff. If you’re not anticipating a trillion-dollar liquidity event and you need your infra to be good enough to give you a fighting chance, you need a neocloud to do the heavy lifting for you.
At least on paper, smaller neocloud customers are David fighting Goliath. OpenAI and Anthropic have remarkable growth rates on their respective logistic exponential curves, and our Datacenter Industry Model currently models them at 56.3% of all lab compute YE2027.
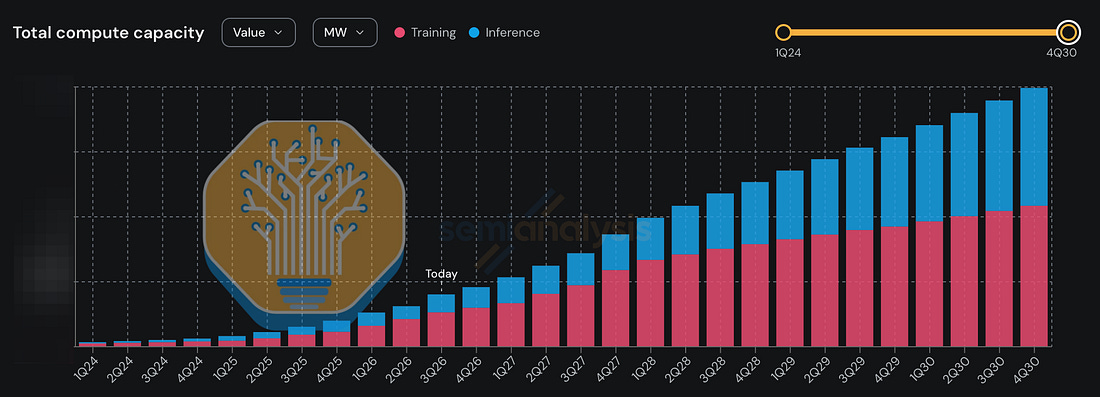
As we will describe in more detail later, there is also a Matthew principle in effect here, due to financing: the profitable frontier labs have an easier time locking down capacity than smaller ones, which get stuck with fat prepays, worse prices, and a much harder time planning years in advance.
Does this mean that managed clusters are dead? cLUsTerMaX iS wAshED? In truth, although Anthropic and OpenAI are taking larger slices by the year, managed clusters as a business are still growing exponentially. We’ve helped countless labs find compute, countless more are on the hunt, willing to pay, and waiting for more capacity to come online. Anthropic and OpenAI are the biggest customers, but there is a long tail of mere multi-hundred-million-dollar deals whose aggregate value is enormous.
One plausible scenario in which managed clusters gain ground on frontier-lab bare metal involves open-source progress. Serving open-source models is already more lucrative than many realize; we recently modeled that “you can make over $100M per MW per year selling open source tokens,” leaving plenty of room for profit even at today’s rental prices. One could imagine open-source models increasing their market share, whether the marginal adopter is more cost-sensitive or algorithmic progress closes the gap to closed-source. Regardless of the dynamics, this would increase the relative standing of managed clusters. Just about any supply-side fracture would make labs marginally less willing to handle the infra, and marginally more willing to rely on neoclouds.
The layers on top of these clusters are rapidly maturing, but they lie outside the scope of ClusterMAX. There’s a handful of niches to consider. There are inference endpoints, which can be either public or private, and bill by the token. There are post-training services, which customize open-source models for specific use-cases. And there are sandbox services, which provide the infrastructure for agents, especially during RL rollouts, and simplify and optimize container and CPU management. These all fit loosely in the category “GPU services” and the border between them can be blurry. For example, a cloud might spin up an inference endpoint with spare capacity after it’s sold managed clusters, or it might provide sandbox infrastructure and also consume it internally as it sells RLaaS. We will be publishing much more about this in the near future, but it is beyond the scope of this report.
For ClusterMAX 3.0, we requested the following from every provider:
32 GPUs (4 nodes of 8-way HGX, or 8 nodes of 4-way NVL72)
High bandwidth network (we asked for 800G RoCE or XDR InfiniBand, but many providers did not have it yet)
10TB+ of high performance file storage (supporting NFS/POSIX mounts and a RWX StorageClass via csi driver)
10TB+ of S3-compliant object storage
A monitoring dashboard (usually based on Grafana)
5 days to test Slurm, and 5 days to test K8s (can be done in parallel, on a SonK cluster, or sequentially, if the provider wanted to take the nodes back and re-provision them)
Blackwell, not Hopper (B200, B300, GB200, GB300) for NVIDIA, or MI355X for AMD are considered acceptable. H100 is now over 4 years old!
We tested the cluster through 3 phases, described below. Of course, we always complement this testing by contacting customers of all these providers and taking their feedback into account.
First, the Audit covers yes/no questions. Is the cluster setup properly? Is software installed? Is it up to date? Do utilities work as expected? It takes about 15 minutes to run. It’s available on GitHub or via {uv} pip install clustermax.
The audit checks the configuration before we put it under load. It covers hardware inventory, software and firmware versions, GPU access, containers, scheduler configuration, networking, storage, health monitoring, and security. We check which components apply to the environment we’re testing, and display pass, warn, fail, and skipped for all our checks. We have released this part for free and will maintain it over time. The rest we keep internally for now.
Performance puts a pass/fail threshold on the performance characteristics of both the individual components of the cluster and the cluster as a whole. These are done through microbenchmarks, and real-world benchmarks.
Specifically, we test:
GPU Compute
Networking
Storage
Lifecycle
Training
Inference
Below we explain this in more detail, but keep in mind that what we test evolves over time.
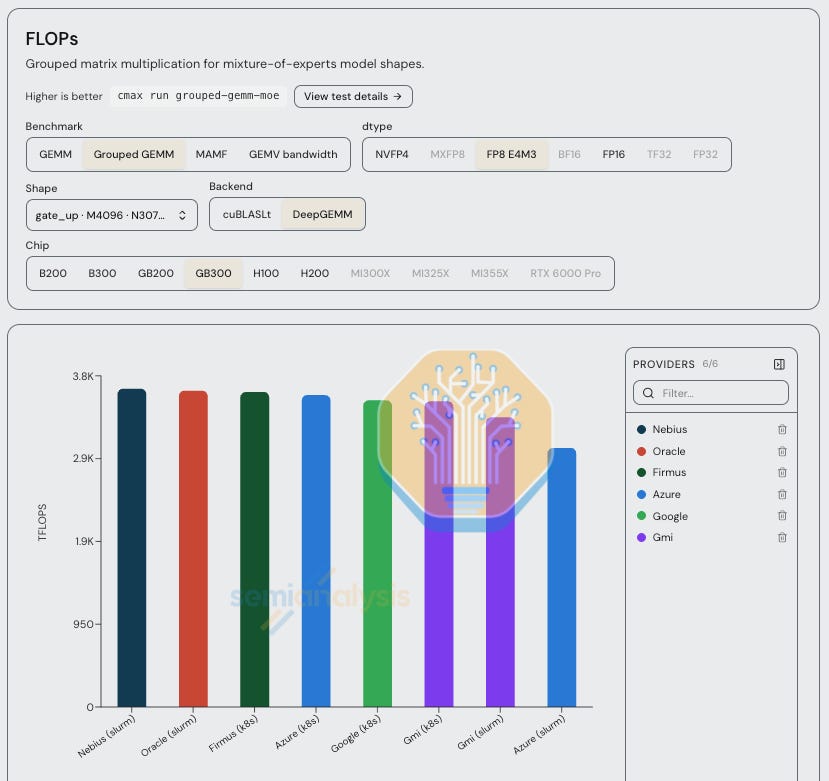
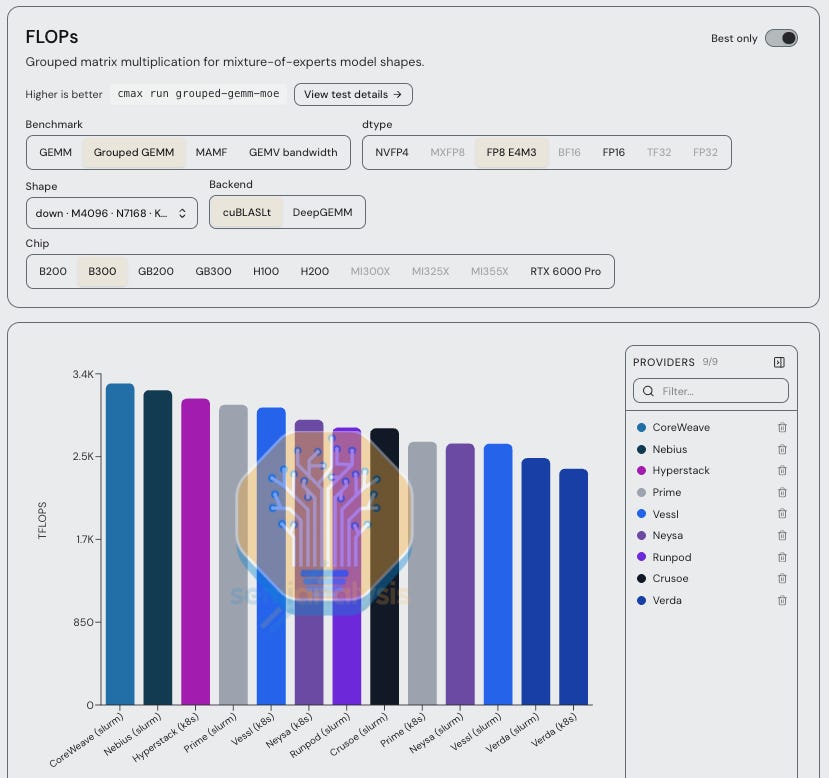
We start by checking the real-world GEMM performance on the GPUs. GEMMs are the most critical operation in modern AI workloads, which we have explained many times before, with Grouped GEMMs being particularly important for modern MoE models.
We test Grouped GEMMs on cuBLASLt (or hipBLASLt) and DeepGEMM across many precision types: BF16, FP16, TF32, FP32, FP8 E4M3, MXFP8, and NVFP4, depending on what is supported by the chips in the cluster. We use a common set of shapes for different gate_up and down projections at varying batch sizes in the Kimi K2.5, K3 and DeepSeek V3, V4 Pro models.
We then test GEMMs, GEMV bandwidth, and MAMF (Maximum Achievable Matmul FLOPS, from Stas Bekman), which runs a sweep for a while on each GPU, per precision, using cuBLASLt (or rocBLAS). We report FLOPs for all of our GEMM tests.
We also test memory, through a GEMV test, and `nvbandwidth`. GEMV measures matrix-vector multiplication with a skinny vector, reporting GB/s as a proxy for the streaming behavior of low-batch decoding. NVIDIA’s `nvbandwidth` utility is built into DCGM health checks, and measures h2d (CPU-to-GPU), d2d (GPU-to-GPU), and d2h (GPU-to-CPU) bandwidth. Finally, we also have a custom PyTorch script that measures the same paths through actual tensor copies, recording bandwidth for pinned h2d, d2h, and local HBM copies.
Last, we test HPL-MxP for the boomers. HPL-MxP solves a large dense linear system using low-precision factorization, which means we hit compute, memory, and communication together. The test covers compute, HBM, MPI broadcasts over the scale-out network, NVLink, and numerical correctness in a single workload. We report FLOPs across a range of number formats depending on the chip type.
Although GEMMs are the heart of modern AI workloads, these microbenchmarks very rarely distinguish providers—it would be hard for a provider to mess up this functionality. It’s important to check raw GEMM perf is during an extended burn-in, as described later, when a chip’s clock speeds might drop to avoid overheating if it is not properly cooled. On a GEMM burst, you’re unlikely to find much of note. We run these tests on every provider because it’s quick and because a cluster is immediately unusable if they fail, but we worry more about other tests.
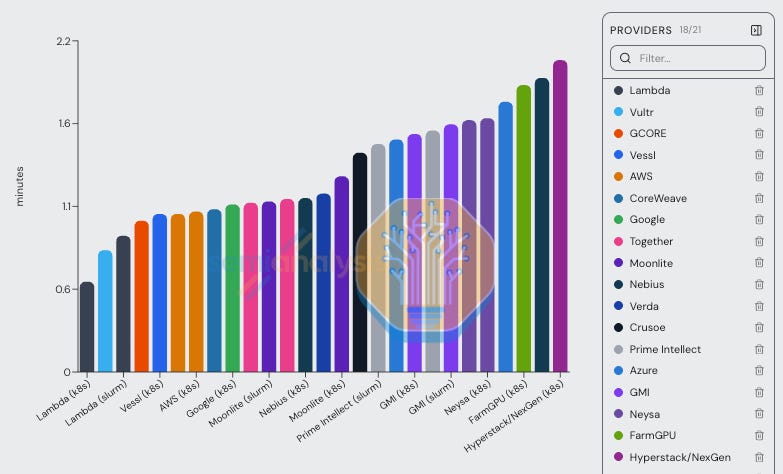
In order to understand the ease of use of the cluster throughout its lifecycle, we have a set of contrived tests that we use. We start by checking internet speed using multiple approaches for download/upload speed, mostly from Cloudflare. We then test the time it takes to install common packages like PyTorch and vLLM via pip and uv, as well as download containers from Docker Hub, ghcr.io, and nvcr.io, and pull a model from Hugging Face and ModelScope.
We then redo the pip and uv install tests with fresh package caches on each available storage tier: home, shared filesystem, local NVMe scratch, and any additional mounts (referred to as `/home`, `/data`, `/scratch`, and other). We then run `import torch` from each location to see how long that takes. On most providers, this takes 1-2 seconds, but on some filesystems with LOSF performance issues, it can somehow take 10-20 seconds.
Finally, we take the models downloaded earlier, and run a vllm serve command to test the time until we can hit /v1/models. Again, while certain providers can load a small model into GPU memory from shared storage in 10-40 seconds, some providers take over 2 minutes.
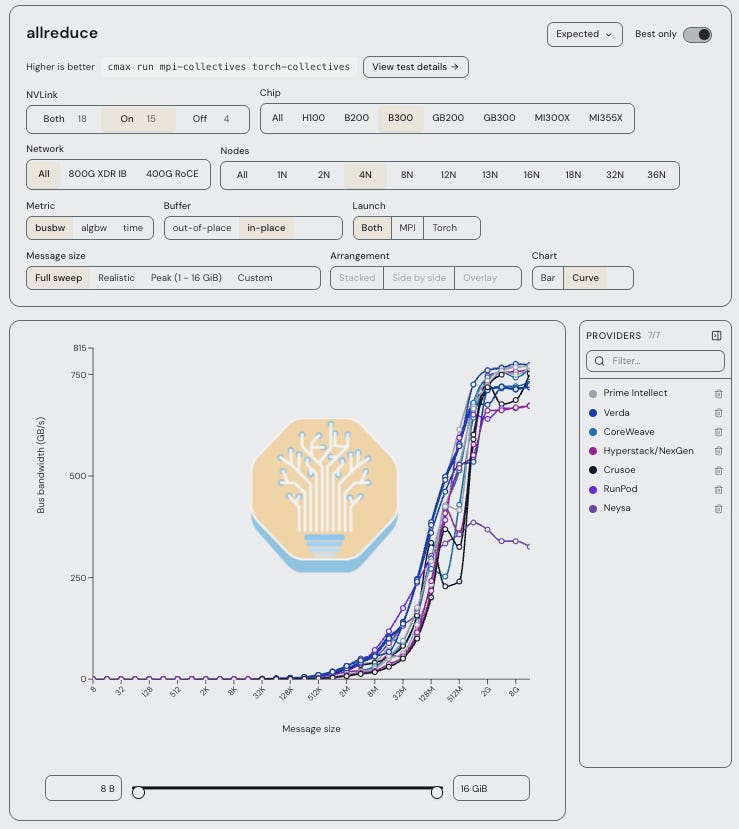
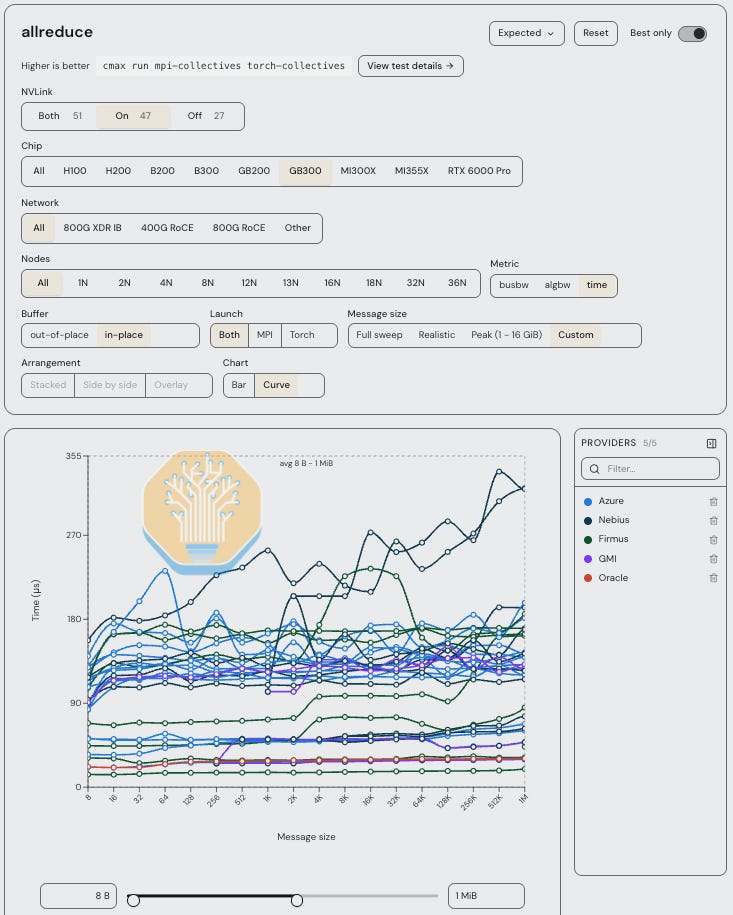
We benchmark a wide suite of communication performance for inter-node and intra-node transfers. This includes MPI collectives, running NCCL or RCCL tests launched through MPI, measuring collective bandwidth and latency across message sizes from 8 B to 16 GB for all-to-all, all-reduce, all-gather, and other collectives. The same workloads are also run through torch.distributed in PyTorch. In addition, we use RDMA perftest, specifically ib_write_bw and ib_read_bw, we measure point-to-point bandwidth on each network rail, along with host-memory fallback (via PCIe), to identify any issues.
We grow the world size in factors of 2 until we’ve used our whole cluster, keeping track of how performance scales. We also run tests with NVLink disabled, particularly on GB200 or GB300 NVL72 clusters, in order to isolate the performance of the scale-out network. It’s important to be careful in your accounting here, since world size, algorithm, and job placement relative to scale-out boundary materially affect results.

We run fio, ior, Elbencho, a custom checkpoint save/load benchmark written in Torch and Torch DCP, and a custom datagen benchmarked shared with us by Skild AI. Datagen is probably the most interesting, as it approximates their real workload in a robotics data pipeline: aggregate write throughput generating the video (MP4) and parquet sensor dataset.
The test that finds the most issues, though, is good old-fashioned fio. We sweep sequential/random reads/writes with buffered/direct I/O with 1MiB sequential blocks and 4 KiB buffered / 64 KiB direct random blocks from c1 all the way up to c32, or, if we have more than 4 nodes, as many clients as the cluster can tolerate. If storage is misconfigured in any way, there is almost always some setting in this fio sweep that shows poor perf. We track throughput, IOPS, and latency, and of course we also discover inconsistencies in metadata if the test fails with too many clients.
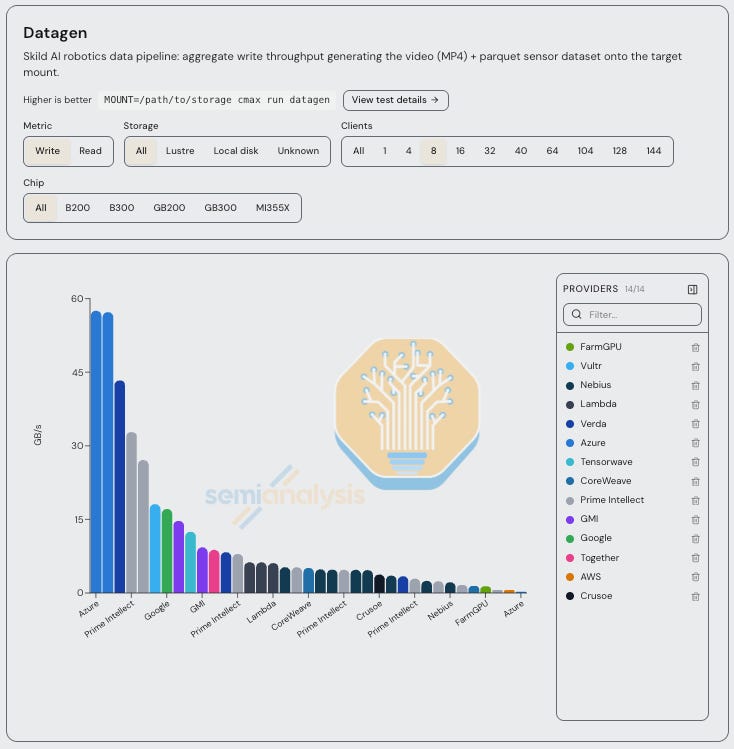
Of course, this significantly depends on how big the volume we’ve been given is and how the SLO is defined. Take these results with a grain of salt—the chart above really only shows that Azure gave us a PB-scale mount. This grain of salt also goes to show why having data on lots of clusters is important. Buffered tests, for example, have higher latency, as you might assume, and can also produce very noisy results if the test is not run for long enough. But how much higher latency, and how noisy? To know the difference between what’s “good enough” and what needs to be flagged to a provider, it’s crucial to compare to a big peer set.
For object storage, we run this suite again against an S3 bucket. We also run a custom benchmark that measures large object throughput on sequential read/write, small object PUT and GET rates, and read latency (p50, p90, p99). In this testing, we keep everything consistent. As always, though, if we notice a cluster struggles with a certain workload, we linger, running more tests to more precisely isolate the issue.
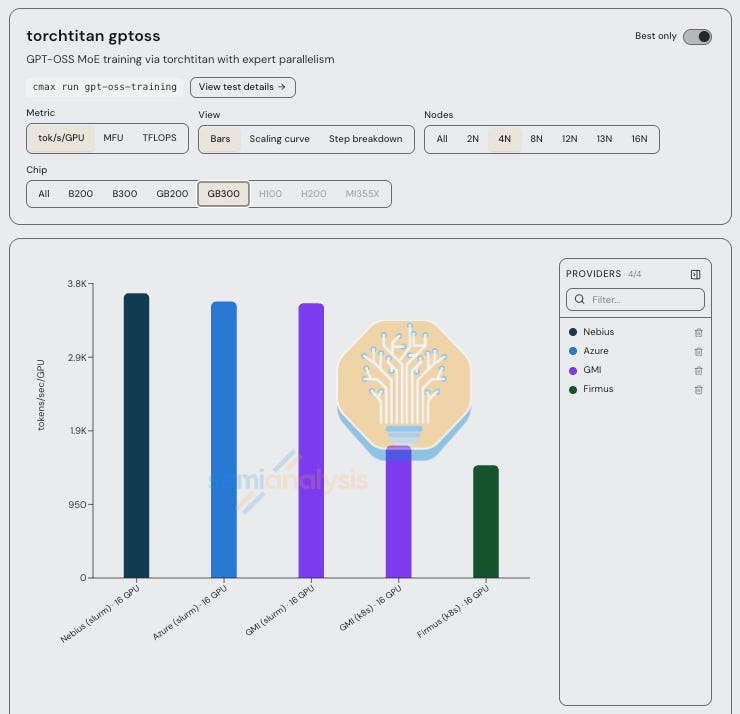
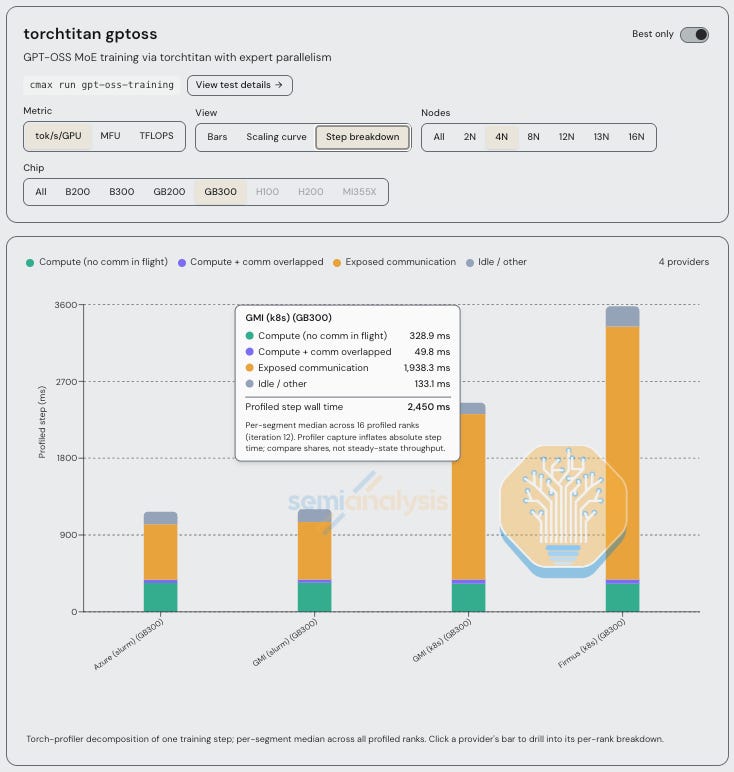
Moving into the real world, we start to see how issues on the network or storage reveal themselves in real testing. We run two jobs via torchtitan: llama 3.1 8B pretraining on the C4 dataset with FSDP, and GPT-OSS MoE training via torchtitan with expert parallelism. The former is FLOPs bound, the latter is collective bound (unless you’re on NVL72). So, the latter makes it plain to see when something is wrong with the network.
We run the InferenceX AgentX benchmark in single node and multinode scenarios with different models to find compute-bound, memory-bound and comms-bound regimes with profiling traces on, treating the InferenceX results as the benchmark performance result to compare to. As with our training tests, this highlights the importance of the various cluster components covered in the microbenchmarks. If a cluster can’t survive NCCL tests, it certainly won’t be able to produce many tokens, and our InferenceX tests show how goodput is lost.
Just because we see solid performance during a benchmark does not mean that the provider can drive solid goodput, and it certainly doesn’t mean they will provide a nice support experience. So, we test reliability, monitoring and autoremediation in multiple ways.
We start with an 8-hour burn-in on the GPUs and network, by running large GEMMs on the tensor cores and all-to-all communications at the same time, with a monitoring script tracking temperature, power, clock frequency, FLOPs, network connectivity, latency, bandwidth, and of course tailing the kernel ring buffer for any errors. You would be shocked how many hardware issues we induce with just this simple test. We cannot emphasize strongly enough how important it is to stress the GPUs and the network at the same time. Burn-in requires simultaneous thermal expansion and contraction of both of these components to approximate the real behaviour of these systems under real stress from real workloads. Lots of providers still use scripts that burn the GPUs and network separately.
Next, we test the sustained performance of the scale-out and scale-up network fabric by looping through all-to-all, all-gather, and reduce-scatter of large message sizes. We report average, minimum, and maximum bandwidth, plus collective errors. On the frontend network, we also test management-network packet loss, RTT, and TCP bandwidth between every directed pair across four nodes. It’s not often that this extra test catches errors that the burn-in did not, but we like the data, and it has revealed big performance differences on certain Ethernet networks under load.
Continuing on, we test filesystem endurance by running 7.5 minutes of sequential mixed reads and writes, followed by 7.5 minutes of random mixed reads and writes, at each client count, using fio (as described previously). We increase clients across the allocation and report bandwidth over time, IOPS, tail latency, and performance degradation. Interestingly, we have seen some providers have bandwidth degradation of almost 40% under load, when compared to the initial benchmark.
When object storage is available, we also run a 15 minute mixed PUT, GET, LIST, and DELETE workload, measuring throughput degradation, p99 GET time-to-first-byte drift, throttling, and errors. We’ve seen about a 10% difference in these tests.
On Kubernetes, we test “churn” by repeatedly creating/deleting GPU pods and checking the API for GPU allocation. We report both scheduling and startup latency, and report failures when kubectl delete po gets stuck. We also increase batches of CPU-only sandbox pods, measuring how many reach Ready, how long they take, and why the rest remain Pending.
Last, we test the PVC lifecycle by repeatedly starting a pod that mounts a volume, writes and fsyncs a file, then gets deleted. We wait for teardown between cycles and use a warmup cycle to remove the initial image pull from the measured runs.
Finally, we get to the fun part: breaking things on purpose.
First, we reboot all the nodes in the cluster. You would hope that this is not a destructive test, but it is. On Kubernetes, we cordon and drain the node, issue the reboot, and require a changed boot ID, then wait for it to return to the cluster. The timer stops when we can run nvidia-smi in a fresh pod on the node. With Slurm, we just get an allocation or SSH and run sudo reboot. Slurm-on-Kubernetes is a little different, so we attempt to do things from the Kubernetes layer to test it correctly. Our scripts time everything throughout.
For injecting failures, we start by using the DCGM injection method. If it doesn’t work properly, we follow up by writing a synthetic NVIDIA XID or SXID message into the kernel log, and watch how the provider’s existing health checks and scheduler respond. We leave their health agents and drain automation alone, so it’s up to their tooling to detect the error and act on it. Most health checks are set up to read from the kernel ring buffer, but some are not, so we communicate with the provider to make sure that our trigger will work and that we have access to pull it. As a final, trusty method, we reset the GPU’s upstream PCIe bridge, which produces a genuine XID 79.
In all these cases, we time how long it takes to detect the failure, how long the node stays in `DRAIN` state, and how long it takes to run a basic command once it returns to the cluster. On AMD systems, we inject a UMC RAS error and track everything the same way.
This is our most critical test. Providers where we hear a bunch of customer complaints about reliability generally do not have health checks, monitoring dashboards, and autoremediation in place. Reliability is the #1 most important criteria to many of the biggest customers in the world, as we discussed in great detail in our article “How Much Do GPU Clusters Really Cost?”
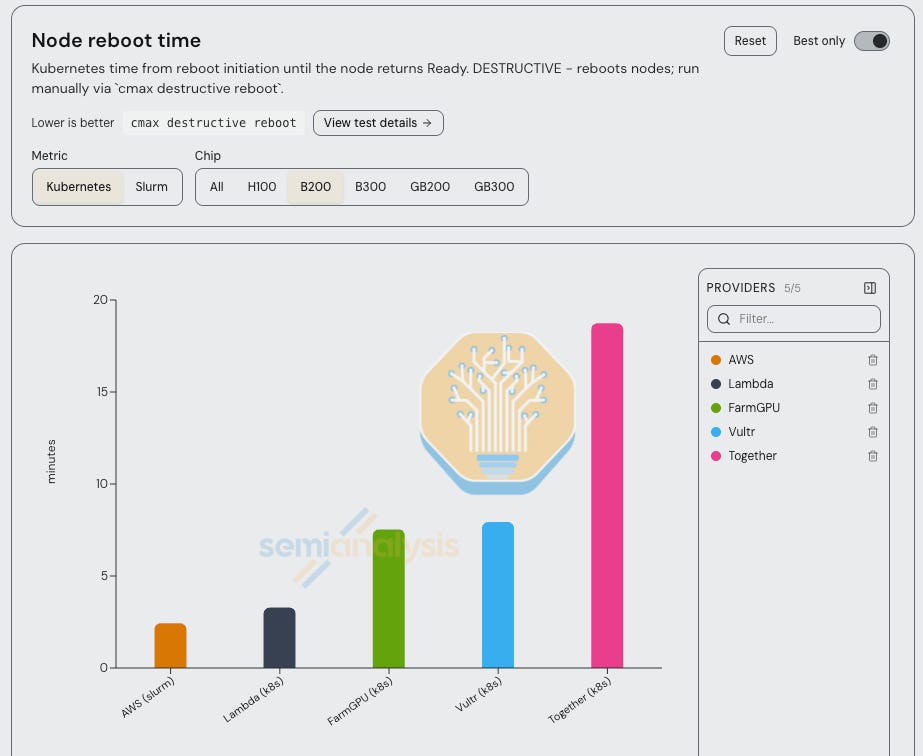
It is worth noting that our hands-on testing is only a part of the overall ratings. There are many things that we cannot test hands on, and need to use other research methods to understand in detail. Namely, performance at scale, reliability over time, support experience, pricing, GPU availability and delivery timelines.
We have two more test suites that we will say much more about in upcoming work.
The CPU is a critical performance consideration for modern agentic workloads, which we have discussed previously. We have developed a comprehensive benchmark that pushes CPU performance to the limits on exactly these agentic workloads, via common Linux tool use and more microbenchmarks in an upcoming project called SandboX.
SandboX runs a range of CPU-intensive workloads representative of code execution, including ring-shuffle producer-consumer queues, Redpanda (measuring a local Kafka-compatible broker and its throughput), and a dynamic load bench.
We also benchmark the sandbox lifecycle of Kubernetes clusters, for insight into how co-locating sandboxes for RL on the leftover CPU/memory resources in a GPU clusters might work. We report cold-start latency, scheduling throughput, density per node, capacity, and baseline.
An RL run has many moving parts: generators that roll out trajectories, environments that execute actions in sandbox, and a trainer that receives rollouts, updates the policy and pushes updated weights back out to the inference engine. Scaling RL means balancing maximizing utilization of trainer, inference engine, environment sandbox executions, rollout transfer, weight sync among other things, bottleneck on any one can stall entire RL stack.
We’re also seeing the emergence of Post-Training-as-a-Service, or RLaaS, where customers bring their own environments, or have forward-deployed engineers build them, and hosted training providers set up the infrastructure to post-train open-weight models. The pitch is customization while protecting the customer’s IP, which apparently is Satya’s tagline now.
In our upcoming PostTrainingX benchmark, we sweep trainer-to-inference GPU allocations, batch sizes, rollout concurrency, and policy-staleness limits to study their effects on performance and training stability.
We track generator performance through input/output tokens per second per inference GPU, rollout latency, KV-cache occupancy, and prefix-cache hit rates. Communication efficiency through weight-synchronization latency, transfer bandwidth, and network telemetry; and trainer performance and stability through training throughput, optimizer-step time, MFU, train/rollout KL, observed policy staleness, clipping fractions, gradient norms, and rejected rollouts.
For environments, we measure setup time, tool-execution time, timeouts, and infrastructure failures. GPU utilization, memory usage, and power consumption provide system-level context, while archived trajectories, logs, and exact environment definitions make results reproducible.
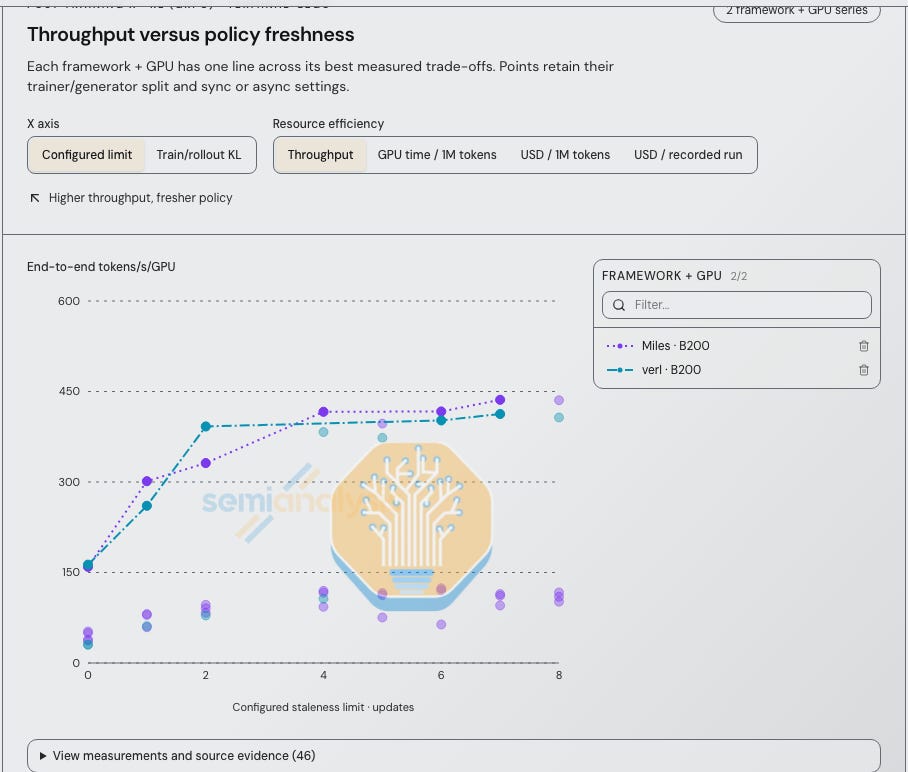
The goal of PostTrainingX is to benchmark every provider. That includes hosted training platforms like Applied Compute, Azure Foundry, Fireworks, Thinky, Baseten, Trajectory, Engram, AI21’s platform etc, as well as open-source frameworks like Miles, slime, prime-rl and verl. The end result should give customers the data to decide whether to run their own post-training stack on open-source frameworks or hand it off to a hosted RL provider.
We’ve already started running on open-source frameworks, including Miles, prime-rl, and verl, and will expand to hosted providers next. Stay tuned…
The hottest topic in neocloud land over the past few months has been financing. Everyone wants to “follow the money”, which is exactly what we do in our AI Compute, Capital, and Markets Model, which we launched in a recent article breaking down how NVIDIA’s Backstop Universe. Below we will discuss a few more hot topics.
Today, neoclouds have realized that a creditworthy customer contract can help them obtain debt at lower rates than their own credit rating would otherwise support. This means that providers without a committed customer (or “IG offtaker”) may need more expensive debt or equity-like capital in order to buy GPUs and either get their business off the ground or grow it. Meanwhile, lenders also need evidence that a provider can deliver its cluster on time and meet the SLAs in their customer contract. Raising debt depends as much on lease termination rights as it does on the cash available for debt service, as well as the TCV. This has led multiple insurance providers to enter the market with parametric offerings that protect neoclouds and their lenders against contract terminations, typically offering a one-month bridge to find a new offtaker in the event of a termination. We are big fans of this structure, and believe it to be a solid method for lenders to use to de-risk these transactions.
In a large neocloud project, the GPU lender and the datacenter lender can face different counterparties within the same project. For example, in the Anthropic TPU neocloud structure, Broadcom supports equipment financing while Google supports datacenter rent. Since several loans in the supply chain can depend on the same AI lab, there can be systemic, correlated risk, even when each loan names a different neocloud or datacenter borrower. Like we just discussed, construction delays can trigger cancellations and impair cashflow.
Enter Nvidia backstops. Since Nvidia supports GPU demand through revenue floors, landlord guarantees, and leases that it plans to transfer to third parties, they are able to help neoclouds and AI labs obtain investment-grade financing without a hyperscaler being involved. Nvidia earns its GPU margin at the initial sale but can now also receive a share of revenue above their “AICP floor”. Their financial support therefore drives demand for their hardware. The Balance Sheet Is The Moat.
This topic has died down a little since we went after Dr. Burry in our article last November. Maybe it was all those 6 year contracts people are signing, or those pesky 4-year-old H100s that just won’t drop in price! Who’s to know for sure.
Either way, we separate equipment purchase dates from in-service dates when we model depreciation. A 6-year depreciation assumption needs provider-specific support, while in NVIDIA’s AICP program, the 6-year revenue floor does not actually establish the useful life of the GPUs. Our depreciation sensitivity tests change modeled margins quite a bit, but IRR remains the priority for lenders, so we won’t be sharing them here. And of course, financial analysis does not establish a real price that a buyer will pay for GPUs in the future. That is up to supply-and-demand dynamics, and the ultimate question: residual value. With lenders unable to set loan repayment schedules separately from the accounting assumptions that we use to depreciate equipment, we are stuck in a world where no one will take on the risk of assessing a residual value on 4, 5, or 6 year old GB300’s today.
Now let’s get back to the technical stuff for the rest of this article. The good stuff.
As we discussed in great detail in ClusterMAX 2.0, the difference between operating 8-way H100 HGX servers and GB300 NVL72 rack-scale systems is massive. Providers who cut their teeth installing H100s 3-4 years ago, are now contending with the following:
Grace CPUs based on ARM (instead of x86 Intel or AMD)
Blackwell GPUs with sm100/sm103 (with CUDA 13.0+)
Mandatory direct liquid cooling (DLC)
High voltage power (130kW+ per rack, via 3phase 408 or 480V power delivery)
Scale-out networks with 800G CX-8 NICs and 51.2T or 102.4T (800GbE RoCE Spectrum-X) or 115.2T switches (800Gb XDR InfiniBand)
Scale-up networks with NVLink switches and backplanes at rack-scale, 72-way
BF-3 or BF-4 DPUs for the frontend (or converged frontend/storage) network
Multiplanar networks with shuffle boards/shuffle cables
All of these changes have implications on provisioning software, monitoring systems, training of technicians, facility-level electrical, cooling, and mechanical systems, OEM support contracts and relationships, and more.
Just because a provider was successful in the Hopper generation, does not mean that they will be successful in the Blackwell generation.
In our rankings, we put a premium on any provider that delivered Grace Blackwell to us, and frankly gave them a lot more leeway when it came to difficulties during provisioning, monitoring, and reliability/hot spares.
This means that if a customer rents standard HGX nodes that merely connect by RoCE or InfiniBand, we expect to see autoremediation with hot spares available: replacements in under an hour end-to-end and detection in around 2 minutes. However, with an NVL72 system, it does not make sense to hot-swap a tray on a different scale-up fabric.
So, in our testing, as long as a health check notices the unhealthy node (in 2 minutes or less, still) and keeps workloads from being scheduled on it, it has done its job. As mentioned above, we advise many labs and clouds on GB300 NVL72 SLAs, and the most common pattern we see could be called “NVL64+”. This means that there is an SLA applied to each node, but in the event that 3 or more of the 18 nodes in a rack fail at a given time, the whole rack is considered down. This is due to simple powers of two: lots of jobs are divisible by 64, and run on 64 GPUs, while the max config to fill up 72 GPUs is world_size=8 * num_jobs=9.
Interestingly, moving from Grace Blackwell to Vera Rubin requires a lot less changes than moving from Hopper to Blackwell. Providers still manage an Arm-based CPU, a liquid-cooled rack-scale architecture, a 72-way NVLink scale-up network, a multiplanar scale-out network, and some Bluefield DPUs. Back when GB200 came along, all this stuff was new!
The major changes are in the move from 800G CX-8 NICs to 1.6T CX-9 NICs on the scale-out network, and increased power moving from ~130kW to ~200kW per rack, including 800V DC options.
Early demand is more robust than in the Blackwell transition—having partially to do with the fact that it’s easier to port GB software to VR than it was from Hopper to GB—and we’re hearing from many providers that they are on track to deliver VR earlier than expected. Bring up has been surprisingly smooth, and the physical design seems to be much more mature.
The scale-out network is the last big design decision a provider still owns. Nvidia and the OEM/ODM lock down most of the NVL72 rack. Outside it, providers pick the topology, the cabling, and how Kubernetes or Slurm hands the fabric to a job. We found problems at every layer.
Starting with the physical layer, 800G CX-8 NICs are multiplanar: each NIC splits its bandwidth across independent switch fabrics, called planes. Total bandwidth stays at 800G per GPU. More planes give each switch more effective ports, and each NIC more paths to uplink, which needs a shuffle. Every NIC lane must land on the right plane, so shuffle boxes put the fiber mapping in a patch module while shuffle cables build it into the assembly. Both work, but there are tradeoffs in terms of reliability (how often you need to service the devices) and serviceability (how easy it is to repair or replace a device).
Oracle is a pioneer in this physical design, and it shows when you get a GB300 node. Each 4x GPU tray we got had 16x physical 200G ports, which means 4 planes per GPU. Linux exposed 4 usable 800G RDMA VFs (rdma_vf_rail0 to rdma_vf_rail3), one per GPU, each in its own VRF. The aggregate PFs failed with no usable GID, so we had to rely on their SPCX NCCL plugin, using 16 queue pairs per connection, and adaptive routing across planes.
Why bother doing this? The answer is scale. Oracle builds Acceleron on this physical design. Their MRC topology paper shows how each NIC splits into 8x100G, which turns a 51.2T switch into 512 ports, and supports 131,072 GPUs at full bandwidth, with only 2 tiers, and a max of 3 switch hops. OpenAI released MRC through OCP in May 2026, and Oracle runs it at Stargate Abilene. The software layer allows MRC to spray one connection across paths and planes, place data out of order, recover loss with selective acks, and uses SRv6 source routing to steer around failed or congested links. This logical layer can get complicated any scale. Its where jobs have issues.
To allocate an RDMA device and use it correctly, Kubernetes must hand each pod the right devices and interfaces. In other words, there are many ways to configure and use the NVIDIA NetworkOperator. Get it wrong, and it’s a headache for everyone.
Our scripts recognizes the following deployment patterns with the NetworkOperator (resource names are examples from the clusters we inspected):
rdma_shared_device: rdma/rdma_shared_device_* with a resource-backed NAD, or a host-network fallback
sriov_host_device: nvidia.com/hostdev or nvidia.com/rdma_host_dev with a HostDeviceNetwork NAD, for direct device access and GPUDirect RDMA
sriov_legacy: a VF via NAD-bound nvidia.com/<resource> and a SriovNetwork NAD, plus RDMA CNI where needed
sriov_ib: an InfiniBand VF such as nvidia.com/mlnxics with a SriovIBNetwork NAD. Partitioned fabrics also need the right PKey and UFM config.
ovs_offload: nvidia.com/switchdev with an OVSNetwork NAD, for hardware-offloaded Open vSwitch.
rdma_ib / rdma_roce: rdma/ib, rdma/roce, or nvidia.com/rdma_*, with one NAD per rail or a host-network fallback.
Provider-specific: AWS EFA (vpc.amazonaws.com/efa and libfabric), DOKS (rdma/fabricN with roce-net-fabricN@fabricN), and GKE DRANET (DRA claim templates and pod resourceClaims).
Device setup and the NCCL plugin on top of it can change job performance. On Google’s GB300, the built-in NCCL library picked an unroutable link-local GID and hung when we tested. Setting NCCL_IB_GID_INDEX=3 fixed it, and Google’s gIB plugin hit 99.5 GB/s on a 16-node, 16 GiB all-to-all vs 95.3 GB/s from other providers, i.e., full performance.
With that said, multinode NVLink is its own problem. The ComputeDomain CRD in NVIDIA’s DRA driver gives each job its own IMEX daemons and channel claims, independent of RDMA. Google, GMI, and Firmus Kubernetes used ComputeDomain, with different RDMA paths: DRANET at Google, shared devices with host networking at GMI, per-rail VFs at Firmus. Meanwhile, Oracle, Azure Slurm, GMI Slurm, Firmus Slurm, and Nebius Soperator supplied IMEX from the host with no tenant claim. Azure AKS ran multi-node NVLink with no tenant-visible ComputeDomain, despite GPU DRA ResourceSlices, and the channel source and tenant isolation boundary were undocumented.
Each ComputeDomain must stay inside one NVLink domain, since crossing domains needs RDMA. In other words, this is topology-aware networking on the hierarchical scale-up NVLink + scale-out RDMA networks. When we launched jobs incorrectly, without ComputeDomain awareness, they just hung in clique setup when placement crossed racks. We will leave our rants about EFA not supporting DeepEP and MoonEP for the AWS provider review later on in the Appendix.
Around the time we started our research for How Much Do GPU Clusters Really Cost?, we started injecting failures into every cluster we tested. The differences between providers were big. Handling a failure takes two things:
Identify it happened
Fix it properly
To identify failures, we recommend monitoring dashboards. A good dashboard shows the failed component, the affected jobs, the current scheduler state, and when each check last ran. A stale green result is not evidence of health. Of course, a monitoring dashboard relies on some telemetry, so you have to have DCGM setup correctly (and securely).
To fix failures, we expect autoremediation: reboots and replacement with hot spare nodes. Autoremediation will not cover everything. Some failures need human intervention, RMAs, and other work that the provider must communicate directly to the customer. We covered the exact cost, measured in the form of goodput, in our article on this topic.
NVIDIA recently open-sourced NVSentinel, a fault detection and remediation system for Kubernetes. It reads DCGM, syslog, and cloud maintenance events, then can cordon and drain nodes, reset GPUs, or reboot. The default install is monitoring only. The software is the easy part. The important part is the mapping from each XID to the action the provider takes. A contained XID 94 needs an application restart. An uncontained XID 95 needs GPU recovery. Clearly, if you naïvely reboot every node for every XID, you’ll kill healthy work, while if you leave GPUs schedulable after serious XIDs, you risk workloads crashing.
This is also why many customers want bare metal only. They just want the provider to close support tickets. Closing support tickets is harder than it sounds. A given ticket can come from any of 100+ XIDs, each with a different meaning and resolution. SOPs cover everything from swapping a drive or power supply, to cleaning cables, to reseating memory, GPUs, or NICs, all the way to RMAing individual components or whole server trays.
There are a lot of different choices for autoremediation, and the right one depends on the system. Also, remediation is a different question for GB than for HGX. On HGX, you swap in a hot spare node with 8 GPUs. On NVL72, you cannot hot swap 8 more GPUs into the NVLink domain. A failed tray takes 4 GPUs down, and the options are to run the rack degraded or to swap the whole rack. The good news is that GB300 tends to fail less than GB200. Either way, the flow from an error to the action in the datacenter is what matters.
Some providers told us they wait before acting, to leave customers time to get their stuff off the node. That is cope. We are simulating a hard failure. The node is dead, and there is nothing left to get off it. (It’s a general truism that if a provider says they choose not to do something because they want to “give their customers optionality,” it is cope, and it’s only a matter of time before the provider recognizes it as such.)
This is where owning and operating the datacenter differs from renting colo. A provider that runs its own facility controls the technicians, the spares, and the SOPs on site. A provider in colo can depend on the landlord’s remote hands and their schedule. Both show up in how fast capacity comes back, and that is what an SLA has to measure.
When it comes to SLAs, we have developed a standardized set of SLAs for 3 tiers of providers
In these documents we provide the following:
Technical definitions for “node”, “rack”, “cluster”, and “site” in two scenarios (HGX 8-way systems, i.e. H100 or B300, and MGX 4-way systems, i.e., GB200 or VR NVL72)
Technical definitions of “downtime” for all systems
Three tiers of associated SLAs (“Bronze”, “Silver”, and “Gold”, with corresponding thresholds and credit penalties associated with downtime)
Two-way commitments for measuring downtime and providing credits
Recommended exclusions from downtime measurement, such as software upgrades, security patches, and physical maintenance
Recommended monthly review cadence for provider performance against SLAs
Contract termination rights for the buyer associated with downtime below recommended thresholds
Definitions of acceptance testing, with descriptions of the types of tests to perform across GPU compute, networking, storage and software to validate a cluster is operational and can be accepted, with recommendations to contact SemiAnalysis for a ClusterMAX technical assessment
Contract termination rights for the buyer associated with missing an agreed acceptance date
Definitions for “force majeure” clauses
… and more
We encourage Compute Buyers (Neolabs), Cloud Providers (Neoclouds), Debt/Financing Partners, and Insurance Providers to use these terms as a basis for their contracts, and to include a SemiAnalysis Technical Assessment during acceptance testing and monthly SLA performance reviews. We perform this Technical Assessment using our cmax utility and a comprehensive, proprietary process.
Please contact us at clustermax@semianalysis.com for more information.
Since we put out “Most Neoclouds Suck at Security,” we’ve been encouraged by the response. Our friends have been running our CLI on their clusters to find which dusty old packages to replace, and there has generally been increased impetus to treat this issue with the seriousness that it merits.
Still, we think it deserves more scrutiny. As discourse reaches a fever pitch over whether AI will kill everyone, there has been almost no analysis of the concrete means by which it could actually elude control and do harm. OpenAI and Anthropic are spending gazillions of dollars doing gain-of-function research, some of their infra has been revealed deeply suspect, and yet it has mostly escaped commentary that GPU clusters—the physical hosts that underlie these models—often have nothing like the immune system that you would hope.
The imperative of good security practices holds regardless of your beliefs about AI capabilities. Even if these clusters were made no more vulnerable by AI tools, the fact would remain that we are spending billions on infrastructure that is not secure as it ought to be. There are plenty of unpleasant scenarios to imagine that involve nothing more than a guy with Vim and a good understanding of operating systems. Read through the Hugging Face reports and tally the number of mundane cybersec errors that let the fire spread.
It’s also worth emphasizing that this is, to some extent, a structural risk. As the industry navigates the hazards of heavy-handed regulation and uncritical social pushback, a breach of an LLM factory is the last thing it should invite into headlines. This is true for cybersecurity reasons—each compromised node increases the number of neighbors for bad actors to explore—as well as ordinary sociopolitical ones—for better or worse, detractors will paint the neocloud industry with a broad brush.
Be a good neighbor and don’t get hacked.

Agentic coding is already putting margin pressure on managed GPU clusters because customers that use AI tools are more willing to take bare metal or lightly managed clusters. We saw evidence for this all the time in our testing. If we needed to add Linux users, but there was no script on the cluster, Codex /goal make useradd script and add my whole team saved the legwork. Especially on clusters with poor documentation, agents helped grind through all the possible configurations to get us unblocked. The corresponding Slack conversation often went something like:
“hey guys, how are we supposed to use XYZ?”
“nevermind, Codex told me ABC.”
“ya that’s right. we’ll add that to the docs.”
Agents helped us most in environments with clear success criteria and good context; otherwise, their approaches to GPU systems were naïve. They have the relevant knowledge, but it is not highly weighted relative to plausible but wrong approaches. Claude, for example, has a habit of overwhelming the Slurm controller by using loops instead of job arrays. One agent of ours decided the NVLink fabric was too much of a pain to configure, instead launching jobs over InfiniBand and declaring victory; another made a similar mistake running storage tests on NVMe instead of NFS; another blamed the provider for poor perf after it tried to schedule GPU jobs onto a CPU node. We usually let agents run overnight, either with `/goal fix this part of the cluster so tests can run` or `/goal try to break this part of the cluster with a realistic workload`. Overall, this allowed us to multiply our output, but sometimes validating the results took longer than it would have to do it ourselves. If you have a good idea how to set up a cluster, agents make you more powerful, and you might even entertain working with a worse provider than otherwise. If you don’t know what you’re doing, your AGI advisor will cheerfully tell you to shoot your foot off. In this semi-legible business, agents magnify skill deltas rather than flattening them.
An insightful example of this is in CoreWeave’s bring-up, which was already among the most rigorous in the industry. Now, in addition to a stringent classical process, they have LLMs run statistics over their fleet, hunting for patterns that flag failures earlier and improve their procedures. CoreWeave also has a NodeBot that provides lightweight reasoning on top of their automated alerts, summarizing the situation and suggesting next steps to simplify diagnosis for the humans in the loop. For example, the team described an event where a thermal interface material pump-out alert should have moved the node out of the cluster for investigation, but a simultaneous PMU halt alert competed to reboot the node instead of triaging it. NodeBot identified the correct action despite that conflict. CoreWeave has experience running GPUs at scale, knows countless rules of thumb that are absent from the training data, and has experts constantly closing the feedback loop to improve their use of these models; even if OpenAI built a banger chip with AI-generated kernels, we don’t expect CoreWeave to be threatened by upstart neoclouds with vibecoded datacenter automations any time soon.
Despite the fact that—let’s be honest—everyone in the industry is using AI at least for some workflows, the only AI-first offering we saw was a nice MCP server provided by AWS. Otherwise, all the documentation was nominally written for humans. The best thing that a provider can do to cater to agents is to provide exhaustive documentation—ideally, much more thorough than a human could ever have gone through—and leave golden recipes on the cluster as a starting point for hillclimbing. In addition to the legacy processes that are not yet AI-first, there are many systems that are strictly worse because they are not built for agents. For example, although letting AI manage your jobs could be good for cluster utilization, it doesn’t respect the old-fashioned systems put in place to aid research. CoreWeave and Nebius have many Slurm-layer optimizations—real job accounting systems with RBAC and priorities enforced on users and groups, carefully managed partitions, job arrays, logs and metrics—that are wasted when everything is run agentically. CoreWeave also tells us that they have seen head nodes run out of memory as remote-control Claude sloporchestrates the cluster. It will be interesting to watch providers improve their AI agent affordances.
As described throughout this article, we have been historically testing clusters. But the market has clearly moved in two opposing directions.
First, the biggest labs are buying bare metal at massive scale, measured in the 100’s of MWs, and have the talent in house to manage their own training clusters, orchestration software, monitoring and reliability. In essence, their neocloud providers (when they use them, and don’t do self build) are datacenter technicians who close tickets. This is a complicated business, and not to be taken for granted: there are 172 unique, documented ways an NVIDIA GPU can fail (XIDs). And many of these failure modes can overlap, resulting in an incredible surface area of different failure scenarios that require a combination of simple troubleshooting logic, human experience, and increasingly, agentic research by AI to recover from these failures.
Meanwhile, many startups are raising 10s or 100s of millions of $$ and spending effectively all of that money on compute. But since so much of this research is driven by RL, via continual learning on real production traces for long horizon agents, the needs for both offline, throughput-optimized inference, and online, latency-sensitive inference is very strong. At the same time, more and more customers are looking for the simplest way to purchase vanilla open source tokens for their workflows.
This leads to our next article, coming soon, where we will describe the Anatomy of an Inference Endpoint, moving towards the inclusion of inference endpoint testing in future versions of ClusterMAX. We believe that all neoclouds need to have an endpoints business going forward.
We will also be evaluating RL infrastructure beyond inference: sandboxes, hosted training, evals, and more. We continue to see lots of new providers enter (and exit) the market every day. It is an exciting time to be in AI, and neoclouds are at the centre of it.
If you got to this point in the article and are still eager to learn more about our individual experience on every provider, you should consider coming to work at SemiAnalysis!
We are actively hiring across Research, Consulting, and Technical Staff. We have multiple openings in our New York and San Francisco offices. Remote work is also acceptable.
ClusterMAX Engineer: all levels of experience with Slurm, Kubernetes, and GPUs considered (full time)
Tokenomics Engineer: all levels of experience with model evals, harnesses, inference endpoints, and RL infrastructure considered (full time)
Research Analyst - AI Infrastructure and Economics: all levels of experience covering the financials of neoclouds, neolabs, and frontier labs tokenomics considered (full time, or internship)
Technical Consultant: lead engagements from technical strategy to technical due diligence. all levels of experience from consulting and technical backgrounds considered (full time)
Thanks for reading, and we look forward to seeing you for future versions of ClusterMAX.
CoreWeave remains the industry’s sharpest, sturdiest, most proactive neocloud.
Our CoreWeave clusters are exemplary in all crucial categories. The health checks work as intended, the reliability is excellent, and nearly all tests reach expected values out of the box. Along with Nebius, CoreWeave serves as a measuring stick for others in the industry—not only in the abstract sense of “excellent performer,” but also in the literal sense that we compare their clusters to lower-rated ones as a means of precisely describing others’ shortcomings. Whereas other neoclouds have to be nagged to refresh their moldy GPU drivers, CoreWeave has not only taken care of the basics, but stood up a significant independent stack for marginal performance and reliability improvements.
The ClusterMAX 2.0 report went into great detail on CoreWeave’s design decisions, including its bare metal provisioning, Slurm fork, use of DPUs, and health checks. Since then, one smart feature that the nerds at CoreWeave have added is called “GPU straggler detection,” which is integrated into their best-in-class dashboard. Rather than leaving their customers to dig through logs or do binary search over their fleet to isolate a bad rank, CoreWeave applies handrolled algorithms to NCCL telemetry and recommends a remediation strategy based on its findings. The CoreWeave team tells us that they use this on calls with their customers just about every day. There are all kinds of soft failures that don’t write an XID or leave any other obvious signature, but waste GPU hours as the job waits on a straggler.
Better than spotting bad GPUs is not scheduling them in the first place; CoreWeave also has systems to make sure every node clears a high bar before it’s trusted with a customer’s workloads. When a node is idle in CKS, CoreWeave runs burn-ins for 20-30 minutes of every hour, validating that scale-up and scale-out fabrics are healthy, GEMM numbers are up to spec, D2H and H2D bandwidth are high, and so on. These tests are pre-empted by customer workloads; invisible to the operator, they help make sure that it’s not production workloads that catch faults. CoreWeave is certainly not the only provider with active health checks, but these are unusually robust.
This diligence extends to CoreWeave’s bring-up process. Provisioning around 10,000 GPUs per week, CoreWeave believes that they have more data than God about what proves a Blackwell rack healthy. In CoreWeave’s view, Nvidia diags are good at catching many failures, but their uniquely deep dataset has allowed them to roll out a custom suite of supplementary tests, including for NVLink. The heart of this process is the Fleet LifeCycle Controller (FLCC), which “automates node provisioning, testing, and monitoring” and owns the path from power-on to handover. Importantly, as others operating fleets at scale can corroborate, there’s a long tail of obscure failure modes not well covered by Nvidia documentation. CoreWeave keeps statistics on these failures to better predict future faults and bakes its response patterns into FLCC. This is one reason that experience with operations at scale is a crucial criterion in our ratings. There is a huge difference between a newbie and a provider like CoreWeave that has rigorous runbooks, automation, and burn-ins. As described in the “Agentic Coding” section above, CoreWeave uses LLMs on top of this system to glean insights that would not be spotted by a human engineer. CoreWeave also works with manufacturers before delivery. Involvement varies by OEM or ODM and by production stage, but in general, the goal is to work backward through the supply chain to catch issues as early as possible: never catch in prod what you could have spotted in bring-up, and never catch in L11 diags what you could have spotted on the factory floor.
Their experience with Blackwell NVL72 bring-up and validation, along with their close relationships with Nvidia and Dell, have allowed CoreWeave to be the first provider to announce a VR200 NVL72 system passing L11 diags. CoreWeave has described VR as “the generation where we bring our own IP.” As the physical demands of compute continue increasing, in CoreWeave’s view, “how the building operates is now part of how the computer operates—they are not two individual things anymore.” Thus, CoreWeave introduced its custom Racky, Valvey, and RLCC in a recent blog post. Particularly interesting is Valvey, a programmable per-rack liquid cooling valve assembly. This gives CoreWeave fine-grained control over each rack’s cooling loop and also, in case of a leak or other emergency, the ability to trigger a shutdown. Despite beginning to adopt a hyperscaler mentality in building its own hardware, CoreWeave frames its approach as anti-hyper: whereas traditional infra emphasizes redundancy and is built to prevent failures, CoreWeave builds to fail gracefully and recover fast, limiting failure domains and allowing nimbler response to the inevitable failures.
Amidst the current trillion-dollar buildout, however, CoreWeave is facing issues responding to the massive increase in cu. Of course, there is plenty of good news to mention. Its relationships with Meta, Microsoft, OpenAI, and NVIDIA—its largest customers—appear strong, and it recently struck a multi-year deal with Anthropic. It has announced splashy deals with HRT and Jane Street this summer. It is also aggressively expanding its capacity in APAC, indicating that it “expect[s] international markets to become a major driver of growth.” Yet it sits with $35B in debt and has already seen investor resistance getting projects off the ground. As a result, CoreWeave has become focused on long-term bare metal contracts, which are easy to fund with an investment-grade counterparty, rather than managed clusters, which have higher margins but which the market is less keen to fund. Moreover, our last writeup mentioned an impressive lineup of recent acquisitions, but since then its Core Scientific merger fell through and nothing else has been announced.
In terms of feedback, some of which is a bit nitpicky:
We wish that their managed SUNK auth RBAC was done on an per cluster basis
We wish that enabling local GPUDirect Storage could be an 1 click button in the UX console
Onboarding new users and where they put the the ssh pub key input in the UX console is extremely confusing to many users that tried
CoreWeave has begun to diversify from bare metal, first by offering self-service SUNK clusters, which gives them the option to sell into the on-demand market when they have capacity for it. They also launched a managed inference platform, which recently disclosed $100M ARR. We are actively testing this for an upcoming article on serverless inference endpoints, though were disappointed to find no support for public endpoints paid by the token. For now, let’s just say that CoreWeave has some work left to do on their inference endpoints.
Nebius was rated the 2nd-best neocloud in the world in ClusterMAX 2.0, yet it remained in Gold. This time, Nebius is unquestionably an industry leader with strong offerings in every category and the ability to command a significant price premium. Nebius moves into Platinum.
Nebius’s relationship with Nvidia remains strong, including a $2B investment in March, as Nvidia disclosed a 9.3% overall stake in July. Nebius was the first provider to deploy HGX B300s back in December of 2025, and has been among the first neoclouds in VR NVL72 bring-up, expecting to begin deployment late this year or early next.
Nebius’s buildout continues across a number of sites in the US and Europe as they recently raised their 2027 year-end contracted power target to 5 GW. In terms of offtakers, Nebius has signed large deals with hyperscalers Meta and Microsoft and smaller ones with Reflection AI and Palantir, making it one of a few neoclouds with multi-hundred-MW hyperscaler agreements that still regularly competes for much smaller startup contracts. They are the most active of all neoclouds in the short-term cluster market, serving many happy customers. The days of Nebius spooking prospects with their Russian accents are behind them. This is mirrored by its capacity procurement: unlike many of its peers, Nebius has opportunistically snatched up sites in the 5-20 MW range through a broad network of datacenter and software partners.
In terms of the clusters themselves, well, a good cluster is generally boring. On Nebius, burn-ins run without errors; Slurm is topology-aware; the packages we need are on the cluster and generally recent; WAN is good; the orchestration layers are free of footguns. One point of distinction technically between Nebius and everyone else is that Nebius builds and open-sources its preferred SonK flavor, Soperator. (CoreWeave, of course, builds SUNK in house, but it is not open-source.) This round, a Gcore cluster we tested used Soperator, and as did Voltage Park and FPT clusters from previous rounds. Nebius writes that “the real magic of Soperator lies in how we use ‘jail’ Persistent Volume”: Nebius provides a VirtioFS volume at `jail`, then bind-mounts it at `/`, so you don’t need to worry about pointing your cache to the right directory, or think much about taking your files with you when you `salloc` a node. You’ll see in our writeups of other providers a handful of gnarly issues with managing the storage system on SonK: Slurm and Kubernetes have different philosophies of persistence, and it’s not always straightforward to provide the illusion of bare metal when in fact you’re several layers up, standing on an ephemeral Kubernetes pod. Nebius’s approach makes this stress-free for the operator.
In particular, Nebius provided us a handful of storage tiers on every worker: `/jail` VirtioFS, `/home` NFS, `/mnt/data/` VirtioFS, `/mnt/local-nvme` ext4, and `/mnt/memory` tmpfs, as well as first-class S3. For I/O-heavy jobs, `/mnt/data` is recommended, whereas `/home` suffices for shared code and other data with lower-concurrency access. When we first tested `/mnt/data`, we saw very slow 4 KiB sequential allocating writes, while concurrent directory creation from 128+ ranks sometimes returned `EEXIST` due to inconsistent metadata visibility, killing our jobs. With our feedback on the pathological workloads, Nebius retuned this filesystem, and it proved sturdy and fast. We pushed it around and verified that the errors were resolved; per-client, it outperformed the median, and we could further verify that it scaled to handle demanding workloads across two racks.
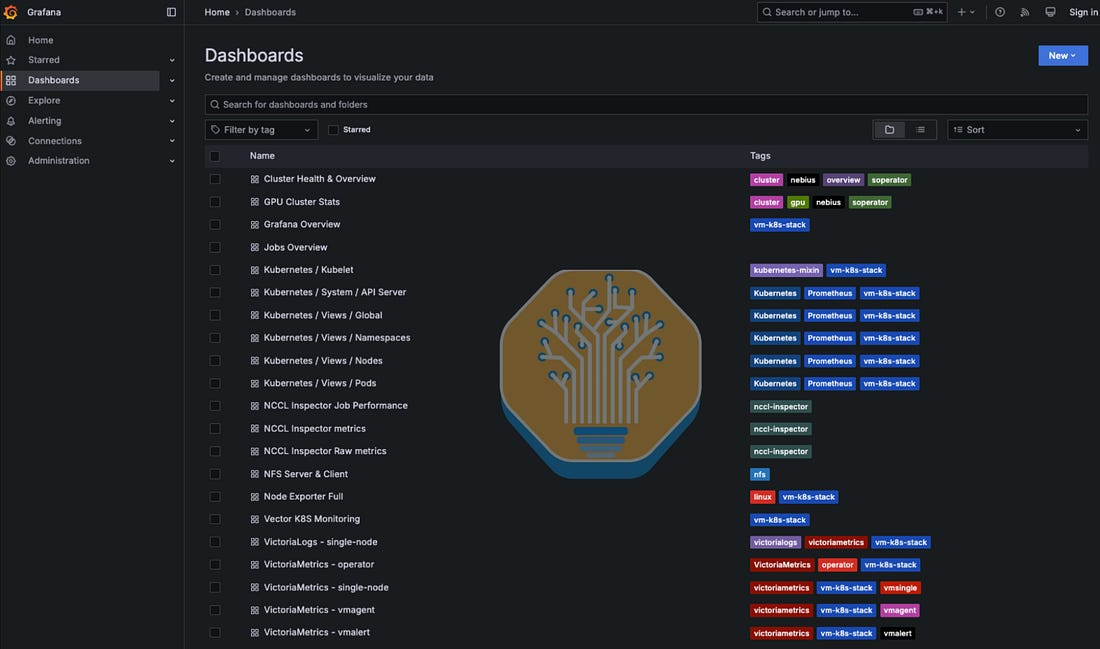
Nebius has put a great deal of work into its health checks, and in our testing, they performed well. Nebius automatically returned a node to service after a synthetic error injection on our GB300 rack; the process is not yet optimized for speed, taking 8h40m from start to finish, but detection is immediate, and the process ultimately works. Moreover, the other GB300 racks we tested did not automatically reboot and return failed nodes, so the fact that this process is self-driving counts in Nebius’s favor. (As we describe in the “Blackwell and Grace Blackwell” section, it’s common not to autoremediate GB300 nodes at all, since there is no real way to hot-swap a node into an NVL72 rack, and troubleshooting is generally way more complicated than with HGX servers.) Nebius also provided us with an excellent suite of dashboards shedding light on, among other things, cluster health.
This all leads to Nebius watching their revenue per MW climb compared to CoreWeave’s (and their market cap along with it). Since they have so much more capacity to sell at the current prices, we expect this trend to continue. Anecdotally, we have seen Nebius get very aggressive during recent negotiations, including a case where they offered a tranche of capacity as a straight-up auction. In general, demanding high prices and sizable prepayments that reach 100% on 1 year commits seems like quite a nice business, especially when those prepayments can cover the entire capex of the servers at the current TCV. Infinite Project IRR anyone?
At their largest bare metal sites, Nebius continues to face delays in construction and permitting, including both Béthune and Vineland, which we have covered extensively for clients of our industry-leading Datacenter Model. But as more chips of all types come online, Nebius’s track record puts them in a strong position to continue to grow.
Overall, we are consistently impressed with Nebius. While we do believe they still trail CoreWeave on many technical aspects and relationships with both NVIDIA and the frontier labs, solid business decisions have established them as the default neocloud to serve the neolabs.
Amidst the strange retreat of Google Brain and DeepMind from the frontier, GCP has been dealmaking like few others. Notable partners include Palo Alto Networks for $10B and Thinking Machines Lab for a “multibillion-dollar deal,” along with expansions of its lucrative relationship with AI safety org Anthropic. With acquisitions of cybersecurity startup Wiz for $32B and energy startup Intersect for $4.75B in cash, Google has been aggressive in expanding its technical capabilities. It also exposes itself to new revenue streams by ramping TPU sales instead of only renting them through GCP, a development we are very keen to track. Its own TPUaaS is still growing, though, thanks to a $5B deal with Blackstone that is targeting 500 MW in capacity. Google has gigawatts in the pipeline, and we look forward to continuing to track its continued competition with the other hyperscalers and labs for access to power and permitting.
With a unique position cutting across so many layers of the stack, Google may have more total engineering talent than any company in the world, yet it has a notably imperfect history in supporting innovation. In ClusterMAX 1.0, we noted a myriad of issues with its platform, yet we predicted GCP would reach Gold or Platinum promptly. It has taken until ClusterMAX 3.0 for this to come true, but Google is finally and comfortably among the best managed cluster providers.
The GCP GPU experience is less refined than that of our Platinum providers, CoreWeave and Nebius. The console feels like the DMV compared to the streamlined UIs of the younger, more focused neoclouds. Access required a Google Cloud CLI that was occasionally uncooperative, forcing us sometimes to switch to the browser-based connection in Google’s console, which was also unreliable. There was a small misconfiguration on our GB200 GKE cluster, where default StorageClass refused to attach to the `a4x-highgpu-4g` nodes, forcing us to try again with a non-default class to get block storage. Nitpicks aside, GKE is very well set up, and we enjoy using it. Google’s managed Slurm is officially generally available and quite solid, with good defaults and health checks configured. A lot of the testing that we did for ClusterMAX 2.0 on their managed Slurm offering is now valid, since the bureaucrats in GCP Product Management are allowing real customers to use the offering, not sticking it with labels like “Beta” or “Pre Release” or “not yet GA.” (By the way, many of the neoclouds we’ll discuss after Google should consider using some of these labels more often—the balance is somewhere in the middle here.)

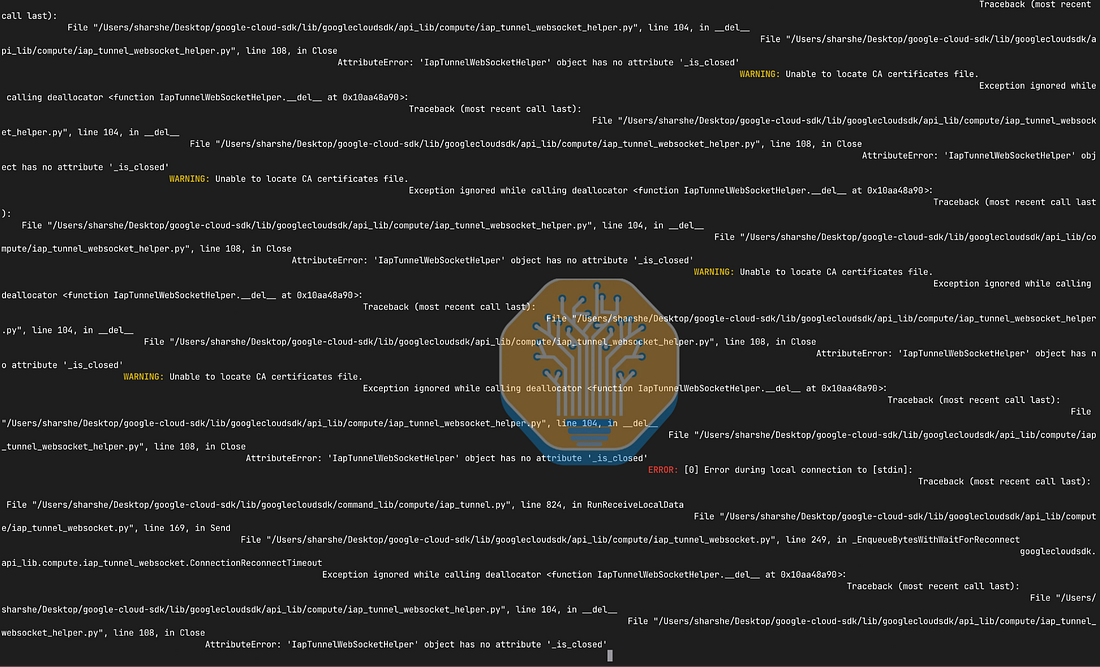
The biggest point of distinction between our GCP cluster and the other clusters we tested was networking. Our first NCCL test hung because automatic GID selection chose the wrong address, but pinning `NCCL_IB_GID_INDEX=3` completed the run. Even then, our NCCL tests were unsatisfactory: you would like to see a roughly logistic curve as performance increases monotonically in message size, but instead we had the following jagged shape:
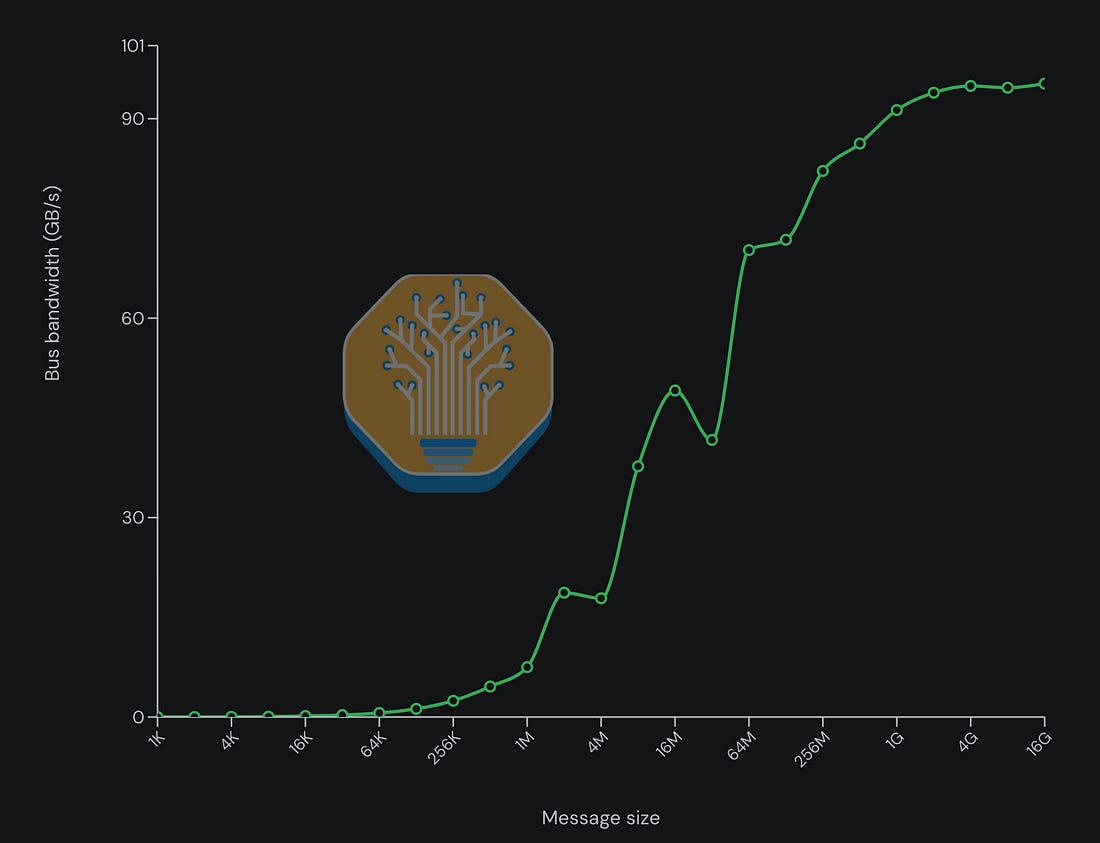
This could conceivably have been an issue with NCCL itself rather than a problem with our GCP configuration. NCCL’s heuristics don’t always pick the right protocol and algorithm for the message size and topology, and some hand-tuning is always expected. However, we have gigabytes of networking data gathered at this point, and we knew to expect better perf. The issue turned out to be simply that we did not have the gIB plugin enabled. This is a set of NCCL plugins Google that ships for improved perf on Google’s RoCE network. As of 26.07, gIB is baked into the NGC PyTorch image, so Google’s customers get the custom stack by default. With gIB installed, we got a better chart with 4.4% higher peak throughput for 16-node all-to-all. (Note that these tests are both with the multi-node NVLink fabric shut off to isolate performance of the scale-out network, which is RoCE in this case.)
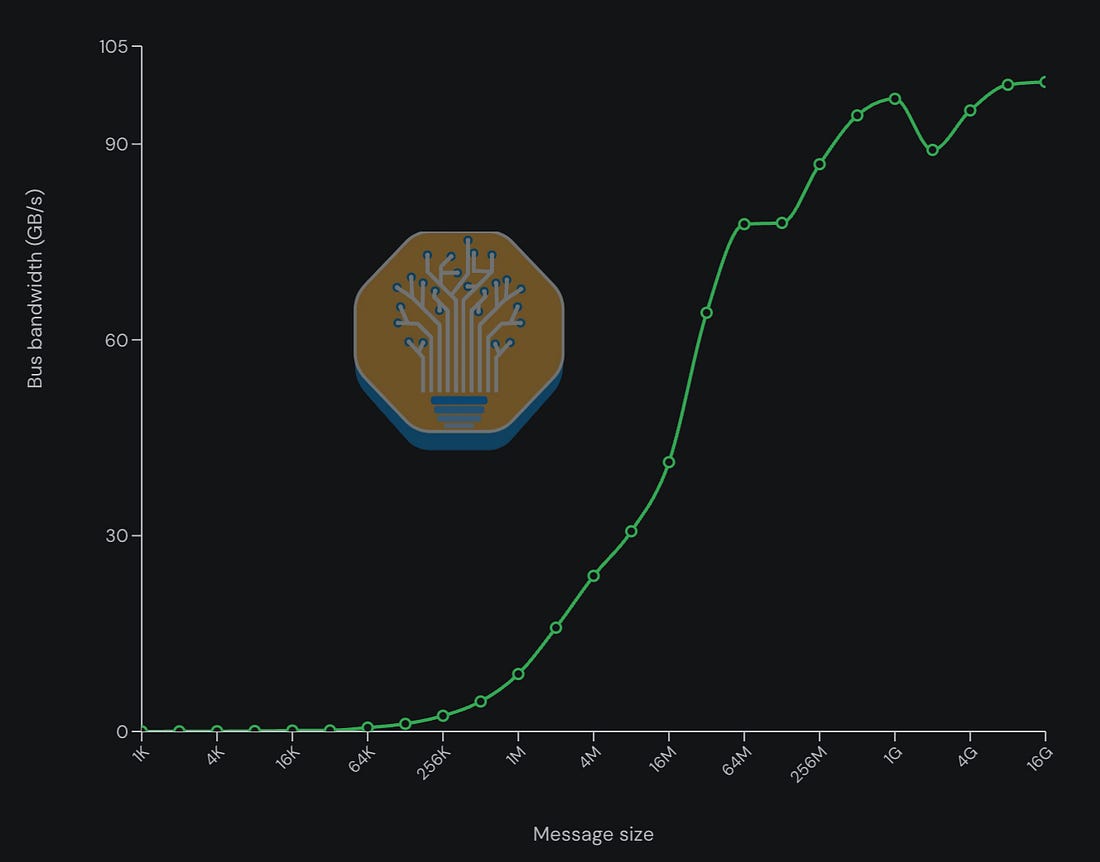
While not perfect, this looks much better, and the topline number is solid. At this point, it was clear that the fabric was healthy, the configuration was good enough, and an engineer looking to squeeze more juice out of the system would have a solid baseline to start from.
This is amazing work by Nvidia and Google to set up auto activation for Google’s ConnectX-7/8 NCCL plugin. Previously, users would need to mess around with the correct library load paths and env vars to get it set up correctly and optimize performance on ConnectX NICs on GCP Nvidia GPU machines. We gave feedback a couple of quarters ago, and now, it is fully automated!
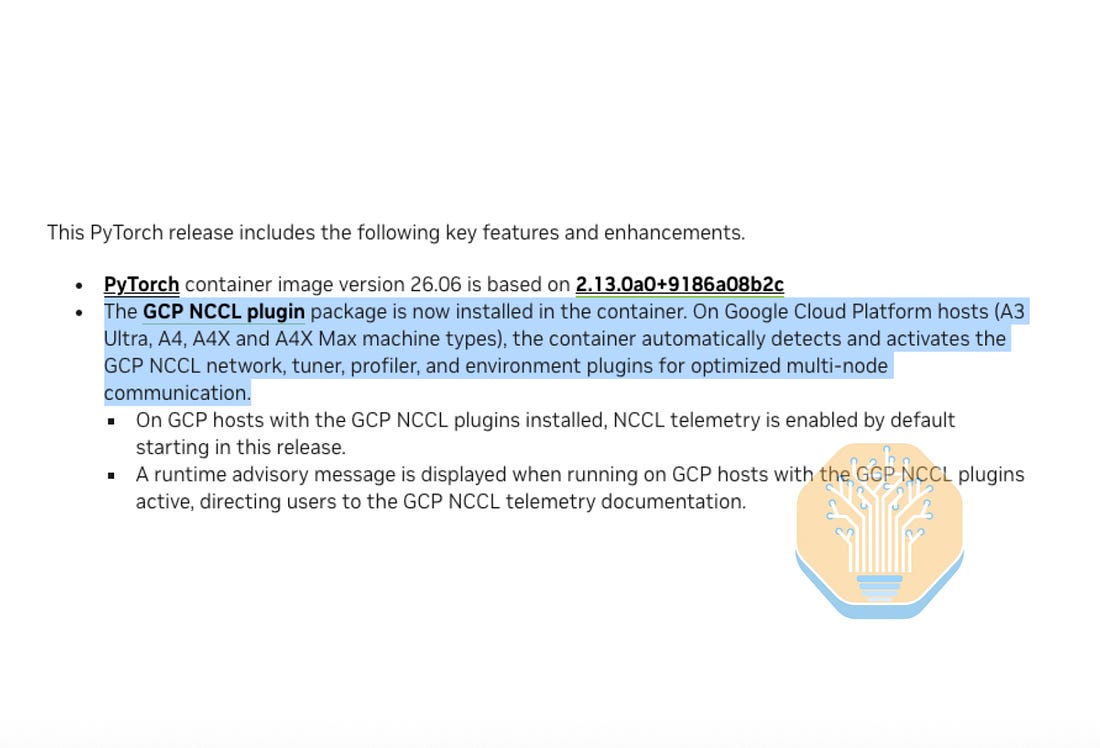
GKE’s health checks worked well. As with other providers who have experience with NVL72 systems, Google’s health checks intervened but left it up to the operator to bring the sick node back to the fleet. In particular, after our XID was injected, the health check marked `GPUUnhealthy=True` and `cloud.google.com/health-check-status=warning`, but left the node schedulable. This configuration was easy to work with, it’s what GCP’s customers prefer as a default, and it can be configured to the user’s liking to respond to errors of various levels of severity.
To continue improving, GCP could take a look at all the quality-of-life changes that Nebius and CoreWeave have made in the recent past. It should ship a better console that’s easier to navigate, simplify IAM and RBAC, and ensure cluster access is painless, either through standard SSH or `kubectl` or by making its existing CLI bulletproof. Especially now that gIB is available in the default Nvidia images, we hope that GCP’s operators have no trouble getting good performance out of their GCP scale-out. They could also continue to pursue neolabs in the mid-market, improve the hands-on support ex